Friday, November 23, 2018

Pearson Product-Moment Correlation

Pearson Product-Moment Correlation

What does this test do?

The Pearson product-moment correlation coefficient (or Pearson correlation coefficient, for short) is a measure of the strength of a linear association between two variables and is denoted by r. Basically, a Pearson product-moment correlation attempts to draw a line of best fit through the data of two variables, and the Pearson correlation coefficient, r, indicates how far away all these data points are to this line of best fit (i.e., how well the data points fit this new model/line of best fit).

What values can the Pearson correlation coefficient take?

The Pearson correlation coefficient, r, can take a range of values from +1 to -1. A value of 0 indicates that there is no association between the two variables. A value greater than 0 indicates a positive association; that is, as the value of one variable increases, so does the value of the other variable. A value less than 0 indicates a negative association; that is, as the value of one variable increases, the value of the other variable decreases. This is shown in the diagram below:
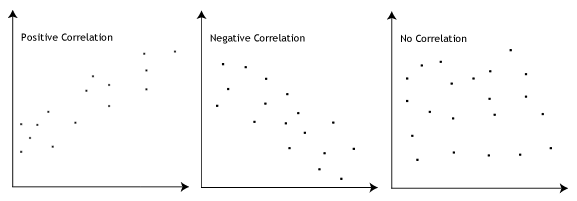
Pearson Coefficient - Different Values

How can we determine the strength of association based on the Pearson correlation coefficient?

The stronger the association of the two variables, the closer the Pearson correlation coefficient, r, will be to either +1 or -1 depending on whether the relationship is positive or negative, respectively. Achieving a value of +1 or -1 means that all your data points are included on the line of best fit – there are no data points that show any variation away from this line. Values for r between +1 and -1 (for example, r = 0.8 or -0.4) indicate that there is variation around the line of best fit. The closer the value of r to 0 the greater the variation around the line of best fit. Different relationships and their correlation coefficients are shown in the diagram below:
Different values for the Pearson Correlation Coefficient 

Stanine Scores

What is a Stanine Score?

A stanine (“standard nine”) score is a way to scale scores on a nine-point scale. It can be used to convert any test score to a single-digit score. Like z-scores and t-scores, stanines are a way to assign a number to a member of a group, relative to all members in that group. However, while z-scores and t-scores can be expressed with decimals like 1.2 or 3.25, stanines are always positive whole numbers from 0 to 9.
Stanines are also similar to normal distributions. You can think of these scores as a bell curve that has been sliced up into 9 pieces. These pieces are numbered 1 through 9, starting at the left hand section. However, where a standard normal distribution has a mean of 0 and a standard deviation of 1, stanines have a mean of 5 and a standard deviation of 2.
stanine
Image: UH.edu

What do Stanines mean?

A person with a score of 9 is in the top 4% of the scorers, while a person with a score of 1 is in the bottom 4%. These types of scores allow you to easily tell if a score is below the mean (a score of 5) or above the mean.

How to Convert a Score to a Stanine

Step 1: Rank the scores from lowest to highest.
Step 2: Assign a stanine score to your scores from Step 1:
Stanine scorePercentage of scores
1Bottom 4%
2Next bottom 7%
3Next bottom 12%
4Next Bottom 17%
5Middle 20%
6Next top 17%
7Next top 12%
8Next top 7%
9Top 4%
The mean lies in the middle of the fifth stanine, cutting the center 20% into two parts.

Loss of Information

Stanines are a very simple way of categorizing items into top, middle and bottom percentages. This simplicity means that it’s a very imprecise way to measure anything. Everyone in the same stanine receives the same score. For example, a person at the bottom of the 5th is almost 20 percentage points below the person at the top of the 5th. These differences are what is called “loss of information.”

Thursday, November 15, 2018

Got prize in essay writing competition


Energy club conducted an essay writing competition on the topic of energy conservation.

Yoga Workshop


As a part of M.Ed curriculum,we conducted a 5 day yoga workshop.


Saturday, November 10, 2018

Paper presentation on women rights and human rights

Human rights forum,Nsstc,ottapalam organised a seminar on human rights with the kind support of the principal on 8/11/2018 from 10 am to 4.30 pm.
                            I got an opportunity to present a seminar on women rights and human rights.


Thursday, November 1, 2018

ICT IN TEACHER PROFESSIONAL DEVELOPMENT


ICT IN TEACHER PROFESSIONAL DEVELOPMENT
Researchers have identified many uses of ICT in relation to TPD that can be grouped in three categories:
  • A focus of study that develops teachers’ abilities to use specific ICT tools, such as online platforms
  • A delivery system providing teachers with information to improve pedagogy and content mastery,
  • A catalyst for new forms of teaching and learning, such as inquiry-based learning, collaborative learning, and other forms of learner-centered pedagogy (infoDev, 2005). 
In other words, professional development in the context of ICT can be placed under three broad headings, namely
  • Learning How to use ICT
  • Learning through ICT
  • Integration of ICT in teaching and teacher learning
  • .Learning How to Use ICT
    ICT with its versatile nature has found its application in every activity related to educational practice. Some typical questions you may have to address while learning how to use ICT are as follows:
    • How do I use ICTs? (Technical)
    • What can ICTs help me do? (Functional)
    • How can I use ICT tools with so many students? (Logistical)
    • Will these ICT tools and technologies replace me as a teacher? Will my students lose respect if they think the ICT platforms have repositories of knowledge that I don't have? (Affective)
    • How do I organize my classroom to support the use of ICTs? How can they be used as part of what I already do in the classroom? (Organizational)
    • How can I learn from and with ICTs? (Conceptual)
    • How can ICTs help my students learn in different ways? How can they support the curriculum? How can they support my teaching? How should I teach using ICTs? (Instructional)
    • How do I assess student learning in ICT-based projects? (Evaluation related) 
    Another way to look at learning about ICT use in educational purposes is to see the various applications of ICT in educational setting. Following is a non-exhaustive list giving an indication on various areas of ICT application.
    • Learning ICT use for instructional planning
    • Learning ICT use for facilitating learning
    • Learning ICT use for assessment
    • Learning ICT use for school management
    • Learning ICT use for inclusive classrooms
    • Learning ICT use for strengthening school community relationship
    In all these areas of educational practice, ICT can be meaningfully integrated. But, one must know the ICT in the first place. For example, to develop digital lesson plans, one must learn word processing. In order to develop student record database, one need to learn some database management tools. A teacher needs to learn a spreadsheet application so that data can be organized, processed and analyzed. These are only few examples for what you have already discussed in various earlier units.
    Following figure gives a glimpse of illustrative Free and Open Source Software (FOSS) tools that are available for educational purposes:
    Figure1: An illustrative concept map of FOSS tools useful for educational purposes (Pic Courtesy: Prof. M. U. Paily, CC BY SA)

Create and play quizzes on the go,Have fun and learn something new!